All Images
Image 1 of 1: ‘Cartoon of a researcher at a Caribbean crossroads choosing between a cracked SPSS path and a paved R path leading to the coast’
One road costs you a license fee. The other one
costs you a learning curve.
Image 1 of 1: ‘Cartoon of a researcher at a Caribbean beach bar opening his laptop to the R console, with an iguana watching from the counter’

The iguana is optional. The coconut water is
not.
Image 1 of 1: ‘Cartoon of a researcher as a Caribbean chef with jars labeled filter(), select(), and mutate(), cooking a pot of tidy data’
You can’t cook without ingredients. You can’t
wrangle without verbs.
Image 1 of 1: ‘Cartoon of a researcher painting a tropical sunset onto a ggplot2 canvas with flamingos and plot axes’
SPSS gives you a chart. ggplot2 gives you a
language.
Image 1 of 1: ‘[decorative]’
Image 1 of 1: ‘[decorative]’
Image 1 of 1: ‘[decorative]’
Image 1 of 1: ‘[decorative]’

Image 1 of 1: ‘[decorative]’
Image 1 of 1: ‘[decorative]’
Image 1 of 1: ‘[decorative]’
Image 1 of 1: ‘[decorative]’
Image 1 of 1: ‘[decorative]’
Image 1 of 1: ‘[decorative]’
Image 1 of 1: ‘[decorative]’
Image 1 of 1: ‘[decorative]’
Image 1 of 1: ‘[decorative]’
Image 1 of 1: ‘[decorative]’
Image 1 of 1: ‘[decorative]’
Image 1 of 1: ‘[decorative]’
Image 1 of 1: ‘[decorative]’
Image 1 of 1: ‘[decorative]’
Image 1 of 1: ‘Cartoon of a researcher as a beach detective following a regression line in the sand while crabs carry p-values on their shells’
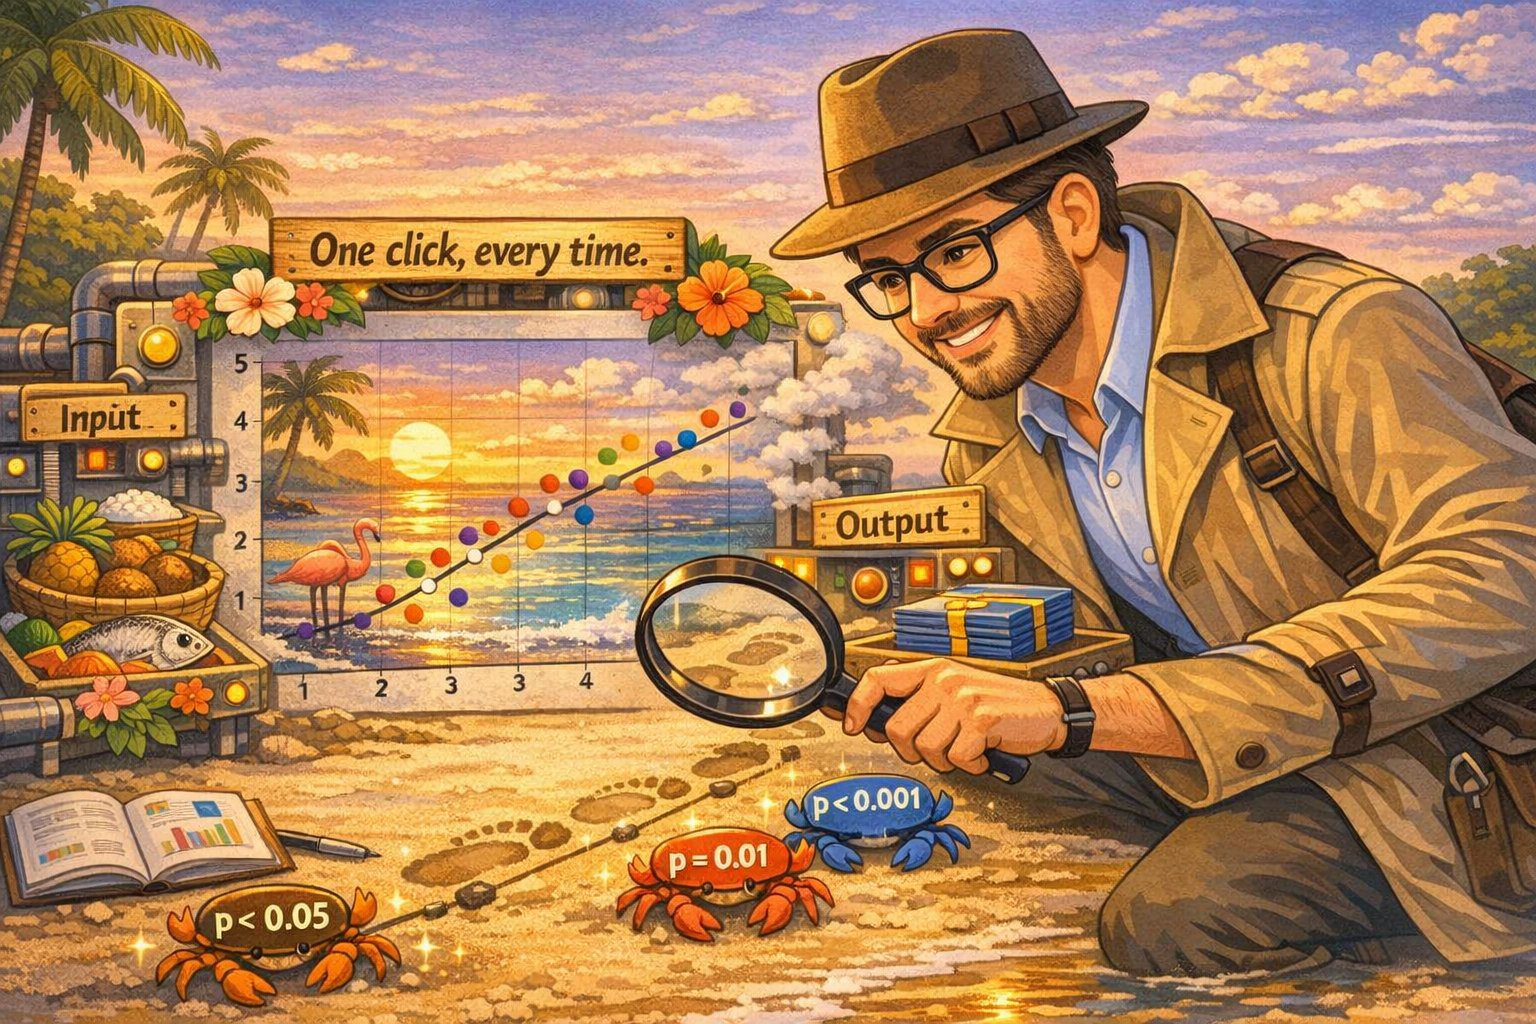
Same tests, fewer menus, more crabs.
Image 1 of 1: ‘[decorative]’
Image 1 of 1: ‘[decorative]’
Image 1 of 1: ‘[decorative]’
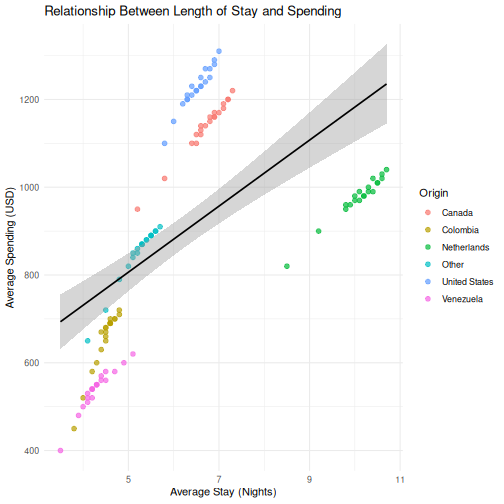
Image 1 of 1: ‘Cartoon of a researcher pressing a big red button on a tropical machine that converts raw data into a finished report’
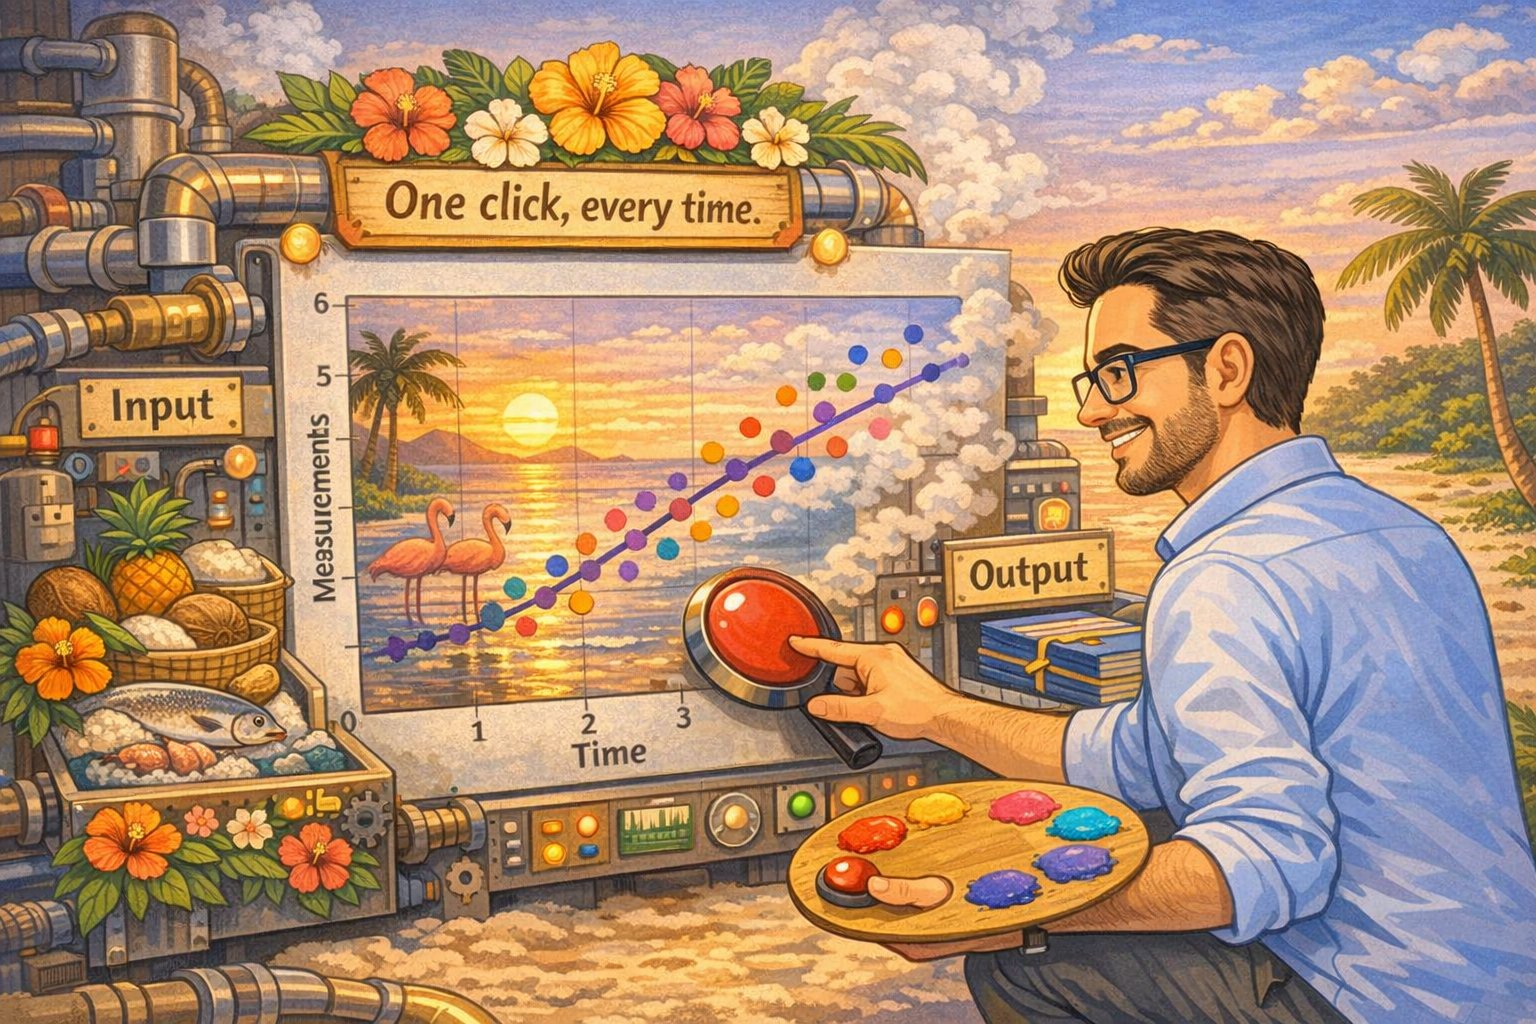
Your supervisor changed the sample. Again. Good
thing you only need one button.
Image 1 of 1: ‘[decorative]’
Image 1 of 1: ‘Cartoon of a researcher on a sailboat studying a treasure map of R learning destinations like Packages Cove and Tidyverse Peak’

You learned the basics. The map has a lot more
islands.
Image 1 of 1: ‘[decorative]’