
Summary and Setup

Blue Wave Analytics: Introduction to R
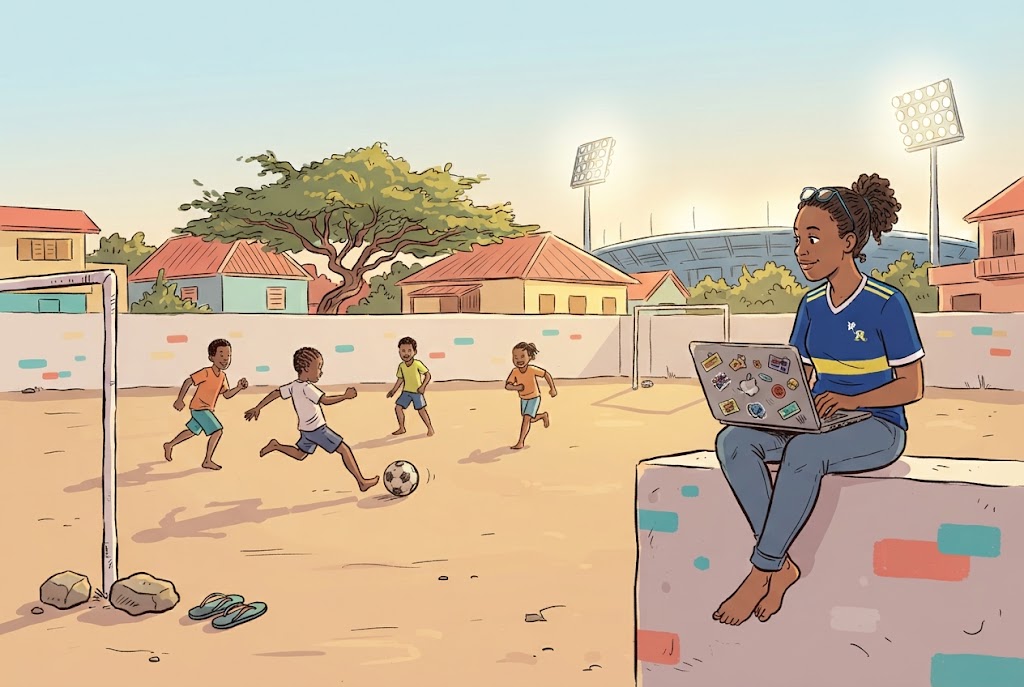
In 2025 Curacao, an island of about 149,000 people, qualified for the World Cup. No smaller nation has ever done it. The Blue Wave got there with limited infrastructure and a squad spread across club football in ten countries, and it showed the world that a small island can perform on the biggest stage.
Football needs a ball. After that it runs on passion, perseverance and, when things go your way, a little momentum. World-class data science has an equipment list that is just as short. The software that analysts at central banks and research universities use is free, and it runs on the laptop you brought today. What is left is the practice.
That is what these two days are for: working towards world-class analysis and visualization, starting with the Blue Wave’s own squad data and finishing with a script you can point at your own work.
You will start from what you already know in SPSS and finish with a script that imports the squad list, reshapes it, charts it, tests it, and renders a document you can run again when the next international window scrambles half the names. No programming experience required. If you are comfortable with means, standard deviations and hypothesis testing, you have enough to start.
One of the two tests you will run in Episode 5 comes back null. That is deliberate. Reporting a result that refuses to be interesting is the thing you will do most often in your own work, and it is the thing courses like this one usually skip.
We talk about AI directly. Episode 2 covers where packages come from and why a curated archive like CRAN is a different proposition from an open upload hub, with the July 2026 Hugging Face intrusion as the contrast, along with what to do when your employer blocks installations. Episode 7 covers working with generated code: what it gets wrong, how to check it, and what should never be pasted into a public model.
This course is the Curacao edition of Introduction to R for SPSS Users, developed by Rendell de Kort (University of Aruba / DCDC Network) and delivered with Marjorie Alfonso. It is open and freely reusable under a CC-BY 4.0 license.
The football is the vehicle, not the payload
This is an introduction to R. Expected goals, expected threat and the rest of the football analytics literature stay outside it. The squad data is what we compute on because a local stake helps people learn, and because the dataset is an honest one with real gaps in it. What you take away is R, and it will work just as well on your own survey, your own budget file, or your own thesis data.
Schedule
Two teaching mornings with a gap day between them, at the University of Curacao. Wednesday 23 and Friday 25 September 2026, 09:00 to 13:00 on both days. Coffee breaks are built in and the course finishes before lunch. Each topic links to its episode so you can jump straight to the material.
Itanium Computer Room, University of Curacao, Willemstad. Registration: https://forms.gle/QbH1iyszxQDqKhvb7
Day 1 - Wednesday 23 September
| Time | Topic |
|---|---|
| 09:00 - 09:10 | Welcome and introductions |
| 09:10 - 09:45 | Episode 1 - The case for switching |
| 09:45 - 10:50 | Episode 2 - Your first R session |
| 10:50 - 11:05 | Coffee break |
| 11:05 - 12:05 | Episode 3 - Data manipulation |
| 12:05 - 12:15 | Short break |
| 12:15 - 12:50 | Episode 4 - Your first visualization |
| 12:50 - 13:00 | Wrap-up and homework brief |
Between Day 1 and Day 2: the homework
The 48 hours between the two days is when the course content becomes a skill. A short practice assignment is waiting for you on a dedicated page, so you can reopen it from any device overnight:
-> Day 1 homework brief
Pick a dataset you already use, write a short R script that imports it, transforms it, summarises it, and charts it. Thirty to sixty minutes is plenty. Bring the script to the Day 2 recap; the first twenty minutes of Friday are set aside for working through what you hit.
Day 2 - Friday 25 September
| Time | Topic |
|---|---|
| 09:00 - 09:20 | Day 1 recap, homework and troubleshooting |
| 09:20 - 10:20 | Episode 5 - Statistical analysis, part 1 |
| 10:20 - 10:35 | Coffee break |
| 10:35 - 11:10 | Episode 5 - Statistical analysis, part 2 |
| 11:10 - 11:20 | Short break |
| 11:20 - 12:10 | Episode 6 - Reproducible reporting |
| 12:10 - 12:50 | Episode 7 - Where to go from here |
| 12:50 - 13:00 | Wrap-up and next steps |
Who is this for?
Anyone who works with data and wants to do more with it: a survey you run every year, a spreadsheet that has outgrown Excel, a thesis dataset, or the monthly figures your department reports upward. You do not need to have written a line of code, and most people on this course have never opened R.
If you already use SPSS, Excel or Stata, you will recognise most of what we do. SPSS comes up throughout the two days as the point of comparison, because it is the tool most people here learned statistics on, and watching the same analysis done both ways is the quickest route into a new one.
- Students
- Working on coursework or a thesis and wanting skills that stay free after graduation
- Lecturers
- Teaching research methods and looking to bring open tools into the classroom
- Researchers
- Wanting analysis that can be re-run, checked and shared, and charts good enough to publish
- Analysts in government, finance and business
- Producing the same reports on a cycle and wanting them to rebuild themselves when new data arrives
Before you arrive
Install R and RStudio ahead of the first day, following the setup instructions. If something fails, reply to your registration email with the error message and we will sort it before the day. Bring your own laptop. The point of the two days is that R keeps working after them, on the machine you actually use, so the install is part of what you take away. The Itanium Computer Room has about twenty machines with R, RStudio and the course packages already installed and tested, and anyone whose laptop will not cooperate moves to one of those rather than losing the morning to it.
You need to install R and RStudio before the first session on Wednesday 23 September. Both are free. Follow the instructions below for your operating system.
Using a work-issued laptop? Check with IT first
Many universities and employers lock their laptops so that users cannot install software themselves. If your laptop was issued by an institution, check with your IT department before following the steps below, otherwise the installer will simply fail.
University of Curacao laptops require a ticket through the IT helpdesk. When you submit the ticket, explicitly ask IT to install both R and RStudio. Asking for only one of them is a common cause of a half-working setup that wastes course time.
Give IT at least a week to process the request so your laptop is ready before the first session. The course runs on Wednesday 23 and Friday 25 September, so a ticket raised after 16 September is unlikely to be resolved in time.
If installation fails
We will not spend course time on installation troubleshooting, so
please arrive with everything working. Follow the instructions below and
test your setup by opening RStudio and typing 1 + 1 in the
console. If it returns 2, you are ready.
If something fails, do not spend your evening fighting it. Reply to your registration confirmation email with the error message and we will sort it before the day.
Software Setup
Install R and RStudio
You need both R (the language) and RStudio (the interface). Think of R as the engine and RStudio as the dashboard. You will work in RStudio, and it needs R installed to run.
- Download R from CRAN. Click “Download R for Windows”, then “base”, then the download link.
- Run the installer with default settings.
- Download RStudio from Posit and click “Download RStudio Desktop”.
- Run the RStudio installer with default settings.
- Open RStudio. If you see a console panel with the R version number, you are ready.
R Packages
During the course, we will install packages together. If you want to get ahead, open RStudio and run this command in the console:
R
install.packages(c("tidyverse", "haven", "readxl", "rmarkdown", "broom", "islandcodes"))
- tidyverse includes dplyr (data manipulation), ggplot2 (visualization), readr (reading data), and more
-
haven reads SPSS
.savfiles directly into R - readxl reads Excel workbooks, including individual sheets
- rmarkdown creates reproducible reports
- broom turns model output into a tidy table (Episode 5)
- islandcodes keeps the Dutch Caribbean islands separable in country-classification joins (Episode 7)
This matters most if you are on a managed or lab machine. Installing packages mid-course is where locked-down laptops fail, and it fails quietly. Getting these in beforehand removes the most common way a session goes wrong.
Verify your setup
Open RStudio and paste this into the console:
R
library(tidyverse)
ggplot(mpg, aes(x = displ, y = hwy)) + geom_point()
If a scatter plot appears in the Plots pane, everything is working. If you see an error instead, reply to your registration email with the message.
Download the workshop data
From Episode 2 onwards you will load the same small dataset in three
different formats: a CSV file, an Excel workbook with two sheets, and an
SPSS .sav file. Download all three now and
keep them together.
- blue_wave_squad.csv plain-text version, one flat table of 94 rows
-
blue_wave_squad.xlsx
Excel version, two sheets:
curacaoandaruba - blue_wave_squad.sav SPSS version, so you can see R open your existing files
Three more files are used later in the course. Grab them at the same time:
- fifa_rankings.csv FIFA rank, population, and diaspora for 211 national associations
- diaspora_change.csv diaspora size in 1990, 2010, and 2024
- blue_wave_squad_2026-09.csv the September 2026 call-up, for the second day
Open each link in your browser, then click the Download raw file button near the top right of the preview and save the file. Do not open the CSV in Excel and re-save. That can silently change the encoding, and it will mangle the c-cedilla in Curacao in a way that causes a confusing error two episodes later.
Check the six files in your Downloads folder before you go further.
They must keep their own names and their own extensions,
.csv, .xlsx and .sav. Some
browsers save every download from the same page under one name, or add
(1) and (2), and a file saved as
blue_wave_squad(2).csv will not be found by code asking for
blue_wave_squad.csv. Rename them now rather than in the
room.
Where to put the files
Create a folder for the workshop, for example
Documents/blue-wave/, and inside it create a subfolder
called data. Drop all six files into data.
Your structure should look like this:
blue-wave/
└── data/
    ├── blue_wave_squad.csv
    ├── blue_wave_squad.xlsx
    ├── blue_wave_squad.sav
    ├── fifa_rankings.csv
    ├── diaspora_change.csv
    └── blue_wave_squad_2026-09.csv
Then tell R where that folder is. The reliable way is Session
> Set Working Directory > Choose Directory, and pick
blue-wave itself, not the
data folder inside it. The lesson code says
read_csv("data/blue_wave_squad.csv"), so R has to be
standing one level above data for that path to make sense.
If you point it at data, every path in the course is wrong
by one folder.
Check it from the console before the course starts:
R
getwd()             # should end in blue-wave
list.files("data")  # should list your six files
If list.files("data") prints character(0),
R is looking in the wrong place.
If none of this works on the day, nothing is lost. Every dataset can also be read straight from the web, with no download and no working directory at all:
R
library(tidyverse)
base <- "https://raw.githubusercontent.com/University-of-Aruba/blue-wave-analytics/main/episodes/data/"
squad <- read_csv(paste0(base, "blue_wave_squad.csv"))
nrow(squad)  # 94
What the data is
The squad file lists the players in the squads of four Dutch Caribbean national football teams: Curacao men and women, Aruba men and women. One row is one player, with their position, their club, and the country that club plays in. 94 rows in total. The Curacao men in it are the squad that went to the World Cup. The September file holds the call-up that came after, and on the second day you will see what changes when you point the same analysis at it.
It is scraped from Wikipedia. Two players have no club listed at all, and the squads are only as current as the volunteers who maintain those pages. Those gaps are part of what you will learn to handle.