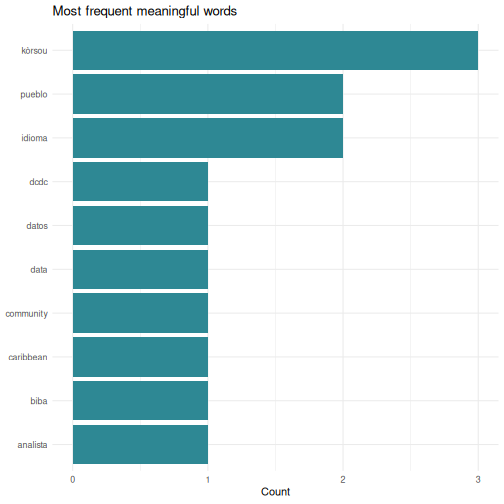
All Images
Image 1 of 1: ‘Cartoon of a researcher choosing between a coin-operated turnstile and an open stadium gate marked install.packages()’
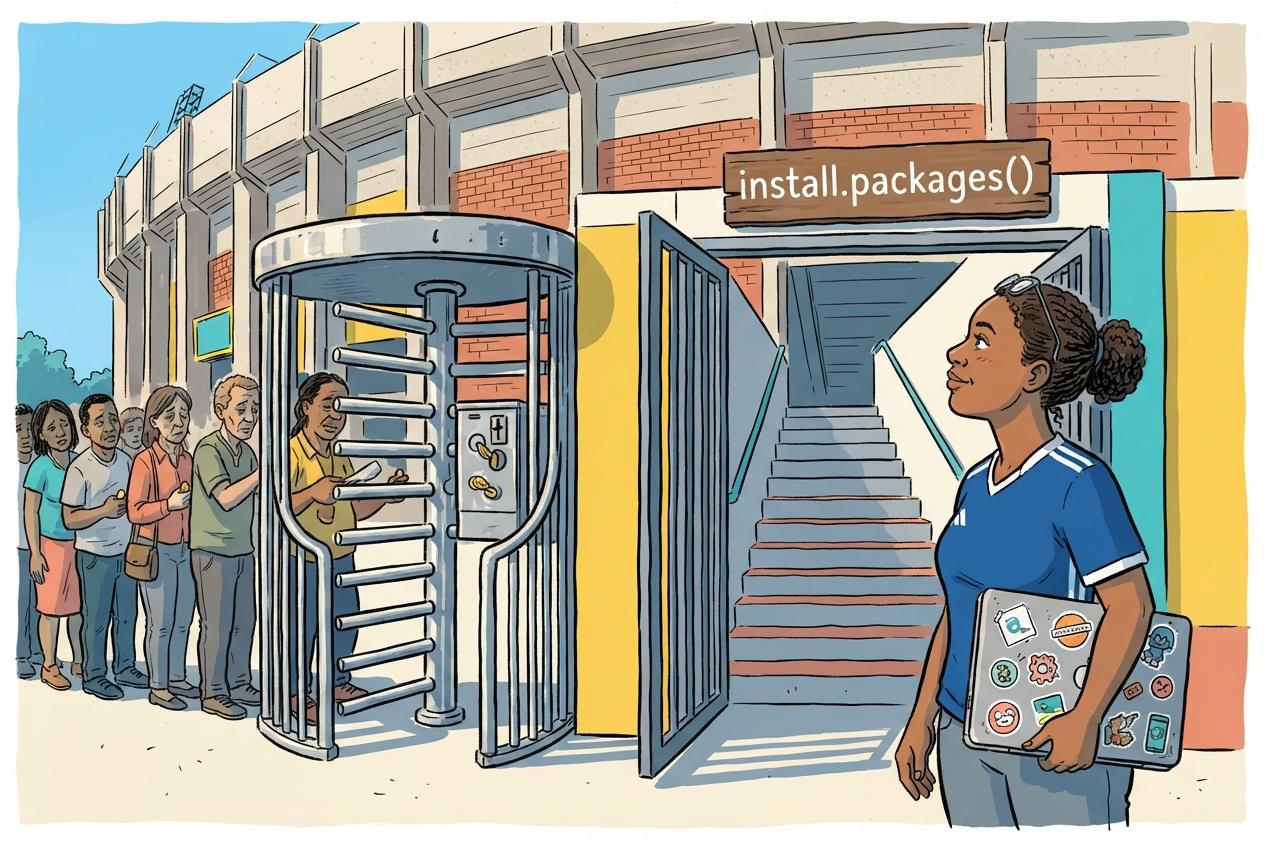
One gate charges you every season. The other one
only asks you to learn the way in.
Image 1 of 1: ‘Cartoon of a researcher opening the R console on a laptop at a neighbourhood bar while an iguana watches from the next stool’
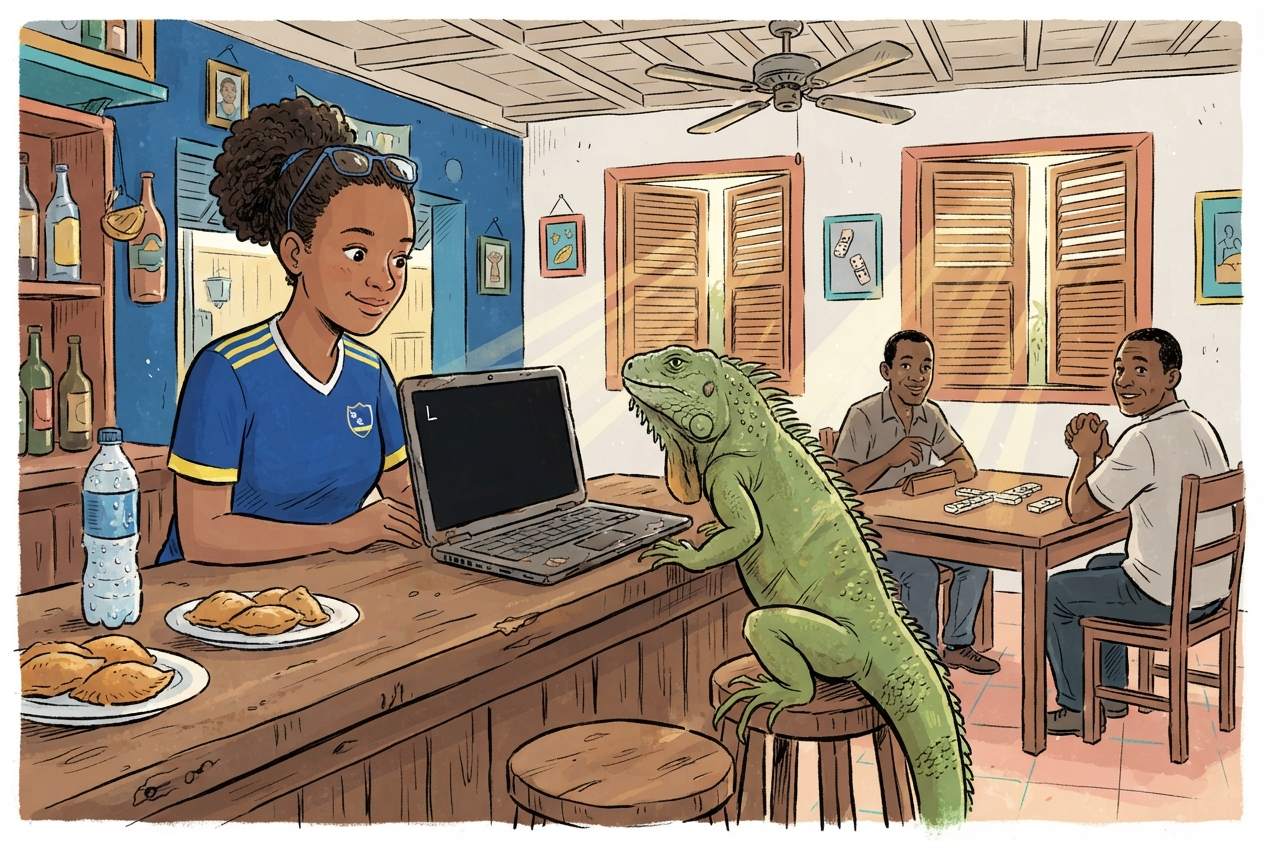
The dominoes can wait. The console is
blinking.
Image 1 of 1: ‘Cartoon of a researcher cooking in a Caribbean kitchen with three labelled jars for the dplyr verbs’
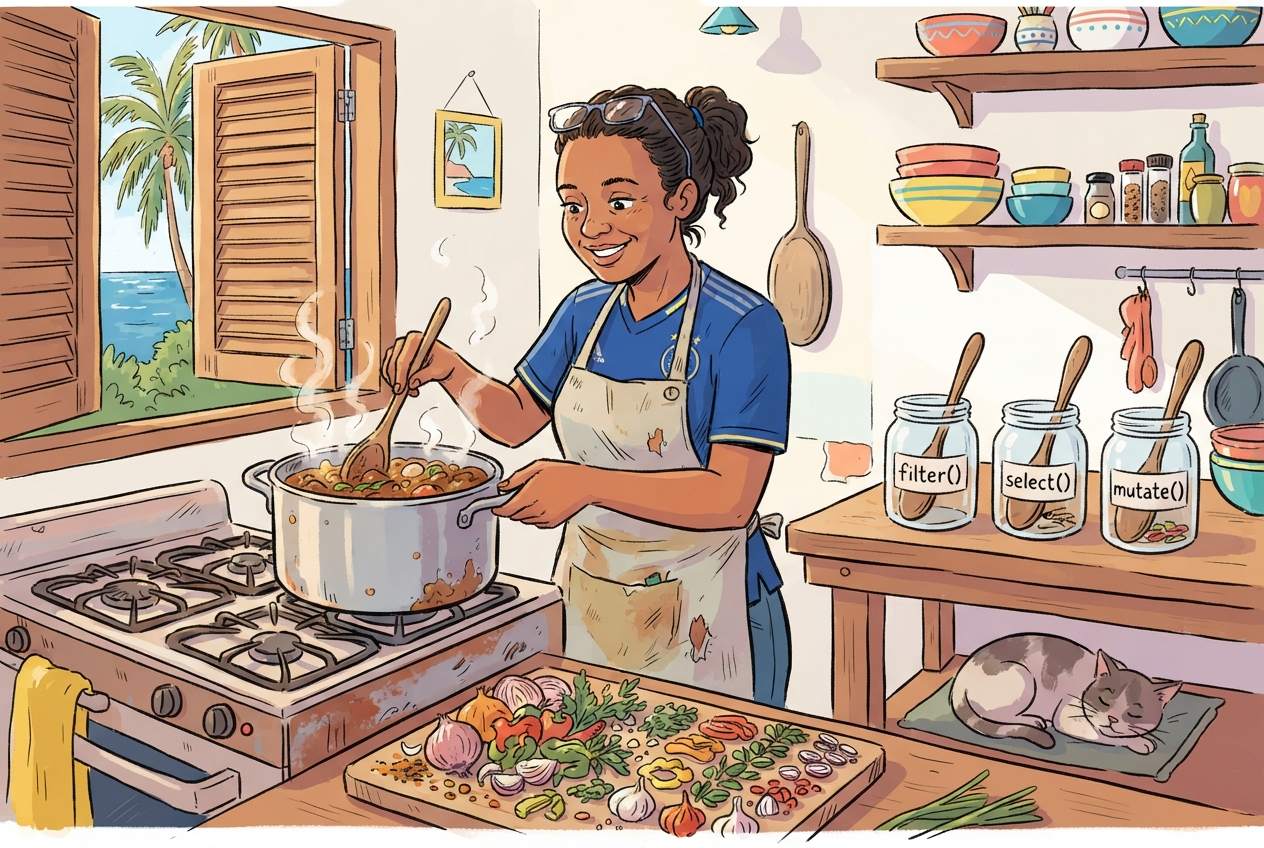
The stew takes twenty minutes. The chopping
takes an hour.
Image 1 of 1: ‘Cartoon of the coloured waterfront houses of Willemstad drawn as the bars of a bar chart, with a researcher painting them into order’
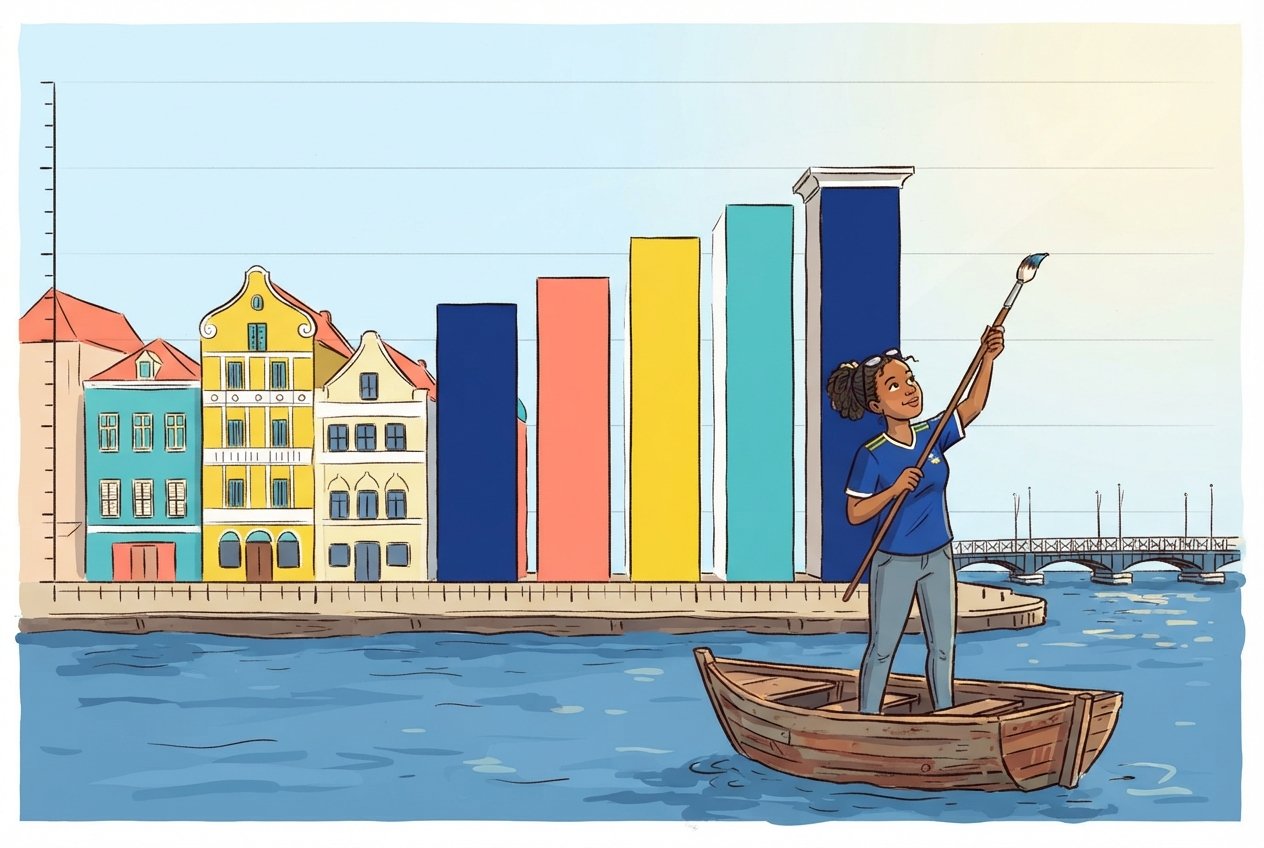
SPSS hands you a chart. ggplot2 hands you a
grammar.
Image 1 of 1: ‘[decorative]’
Image 1 of 1: ‘[decorative]’
Image 1 of 1: ‘[decorative]’
Image 1 of 1: ‘[decorative]’
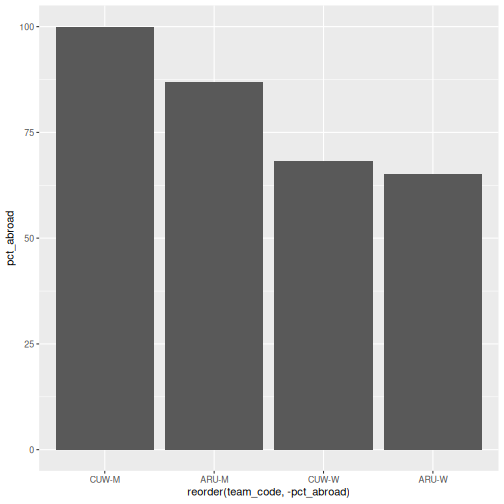
Image 1 of 1: ‘[decorative]’
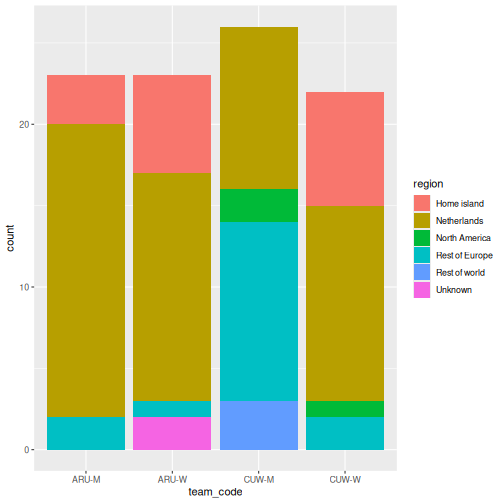
Image 1 of 1: ‘[decorative]’
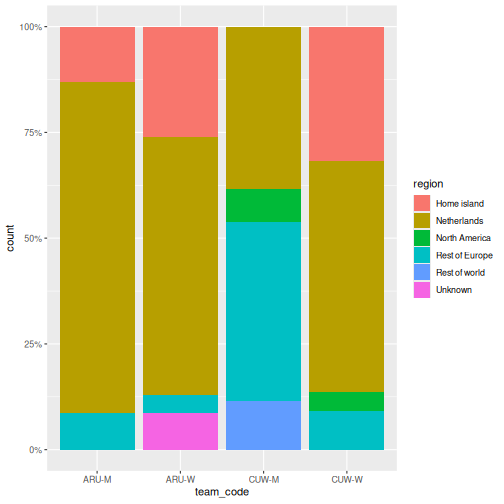
Image 1 of 1: ‘[decorative]’
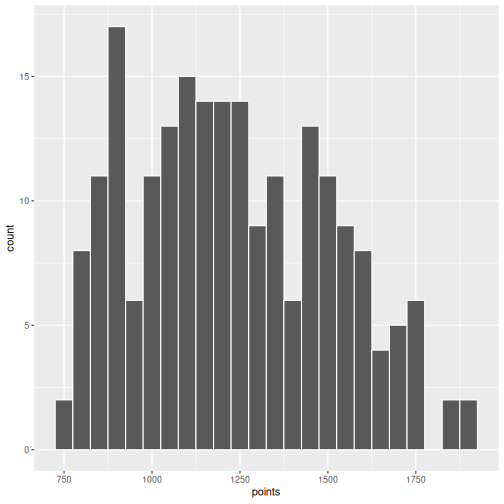
Image 1 of 1: ‘[decorative]’
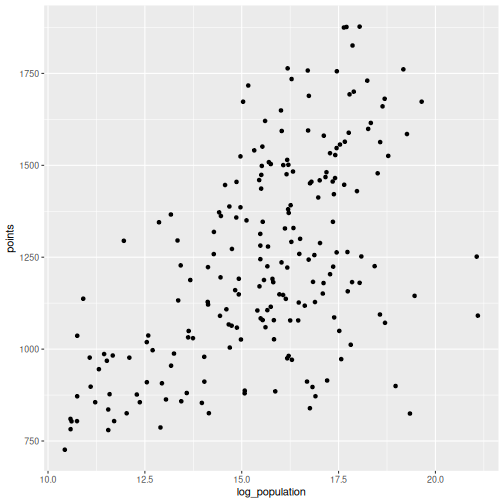
Image 1 of 1: ‘[decorative]’
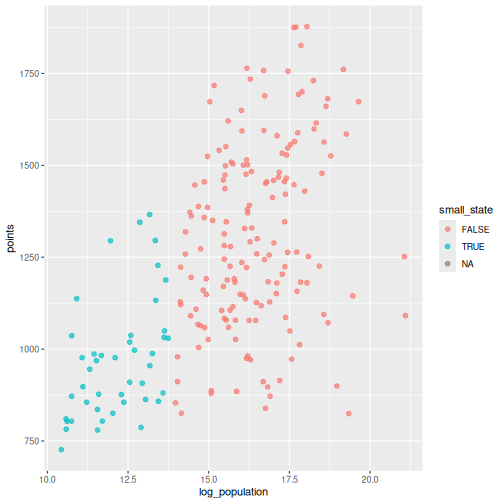
Image 1 of 1: ‘[decorative]’
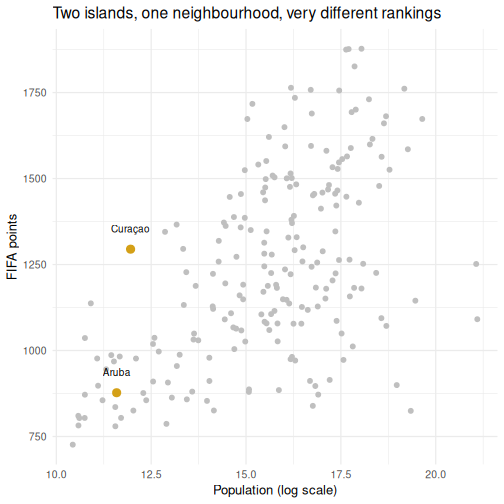
Image 1 of 1: ‘[decorative]’
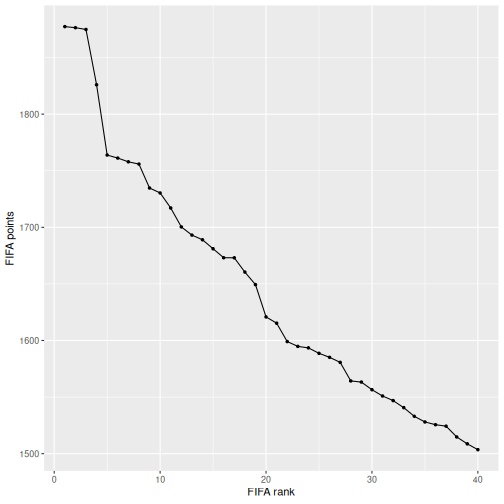
Image 1 of 1: ‘[decorative]’
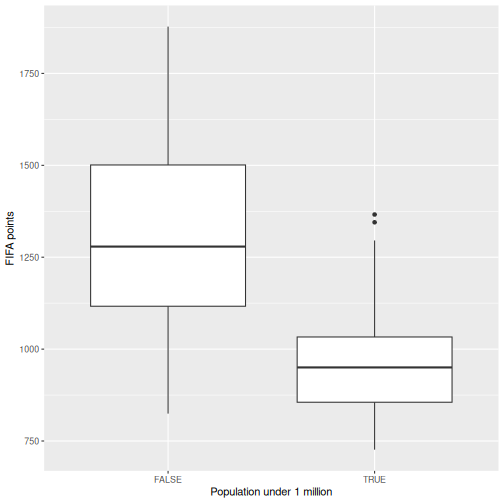
Image 1 of 1: ‘[decorative]’
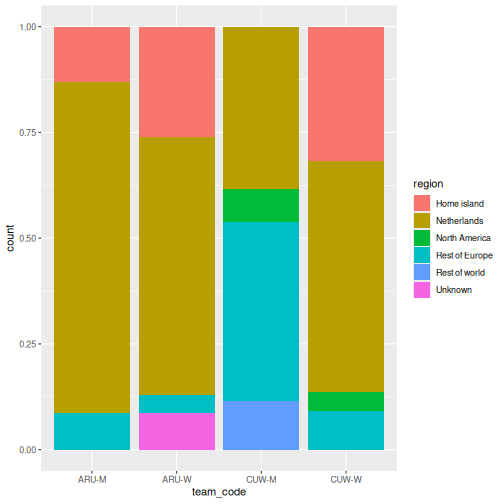
Image 1 of 1: ‘[decorative]’
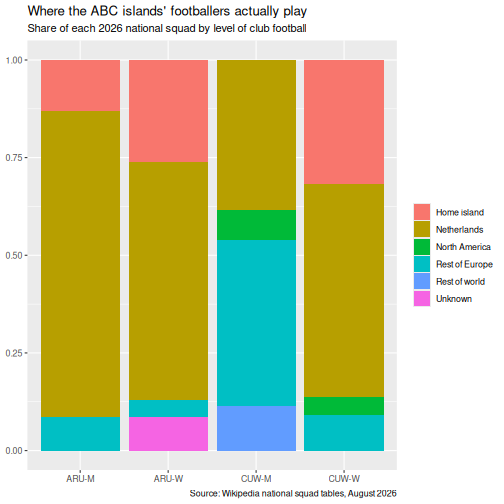
Image 1 of 1: ‘[decorative]’
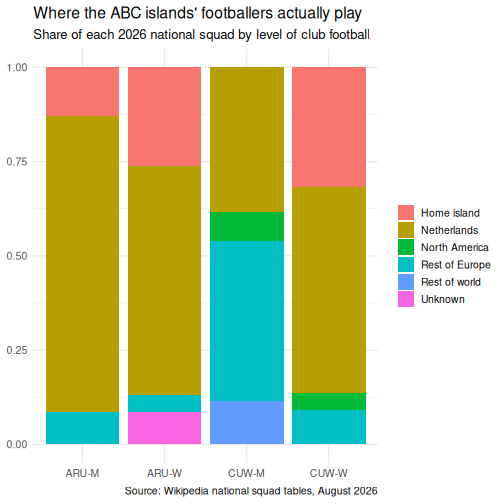
Image 1 of 1: ‘[decorative]’
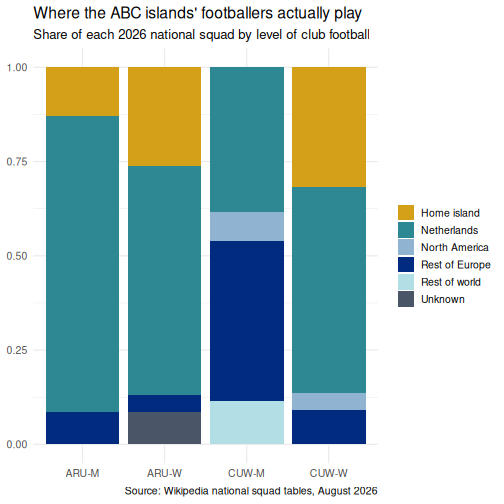
Image 1 of 1: ‘[decorative]’
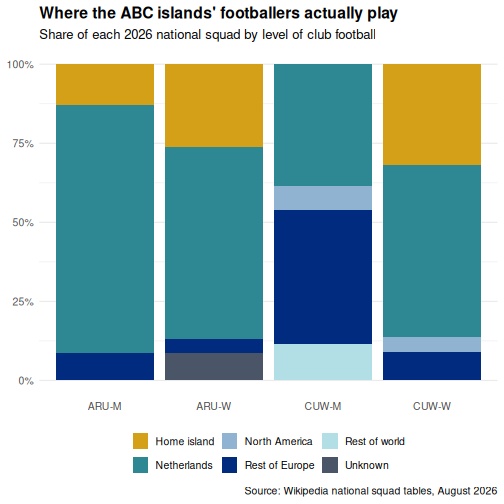
Image 1 of 1: ‘[decorative]’
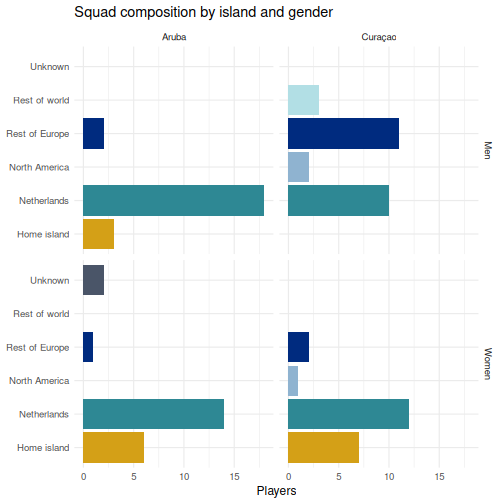
Image 1 of 1: ‘[decorative]’
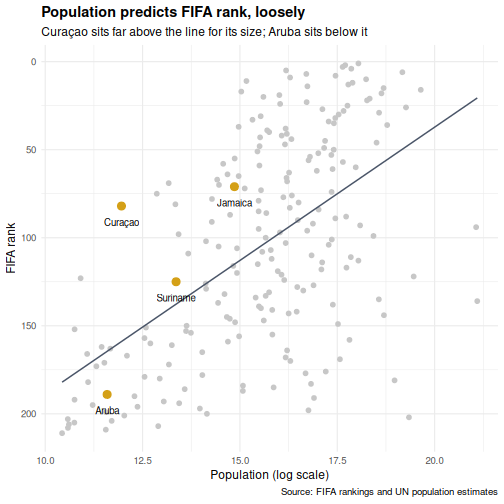
Image 1 of 1: ‘[decorative]’
Image 1 of 1: ‘Cartoon of a researcher at a pitchside video review monitor showing a flat regression line and a null result’
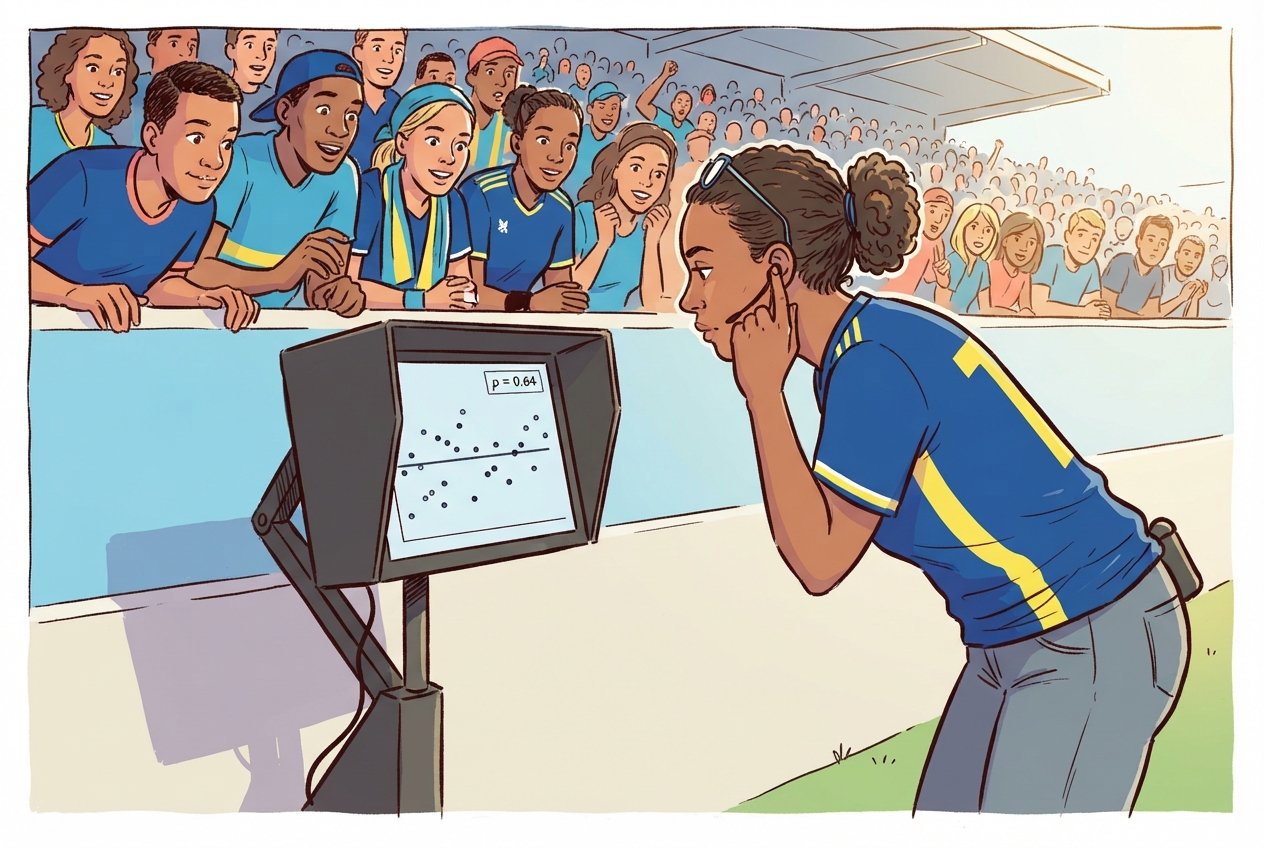
Sometimes the review says nothing happened. You
report that too.
Image 1 of 1: ‘[decorative]’
Image 1 of 1: ‘[decorative]’
Image 1 of 1: ‘[decorative]’
Image 1 of 1: ‘Cartoon of a researcher pressing one button on a machine that turns a changed squad list into a finished report’
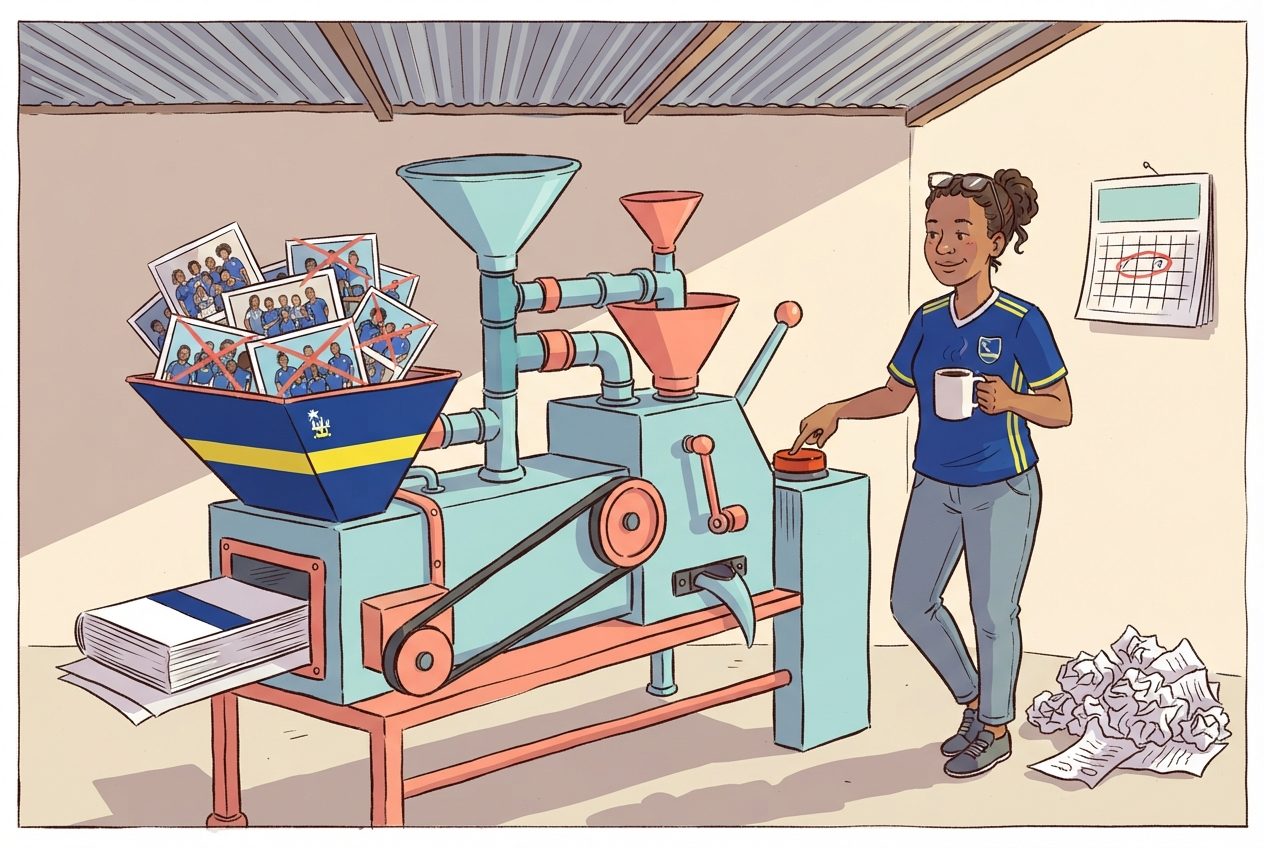
The squad changed overnight. Again. Good thing
the report rebuilds itself.
Image 1 of 1: ‘[decorative]’
Image 1 of 1: ‘Cartoon of a researcher on a small boat leaving Willemstad harbour with a chart of R learning destinations’
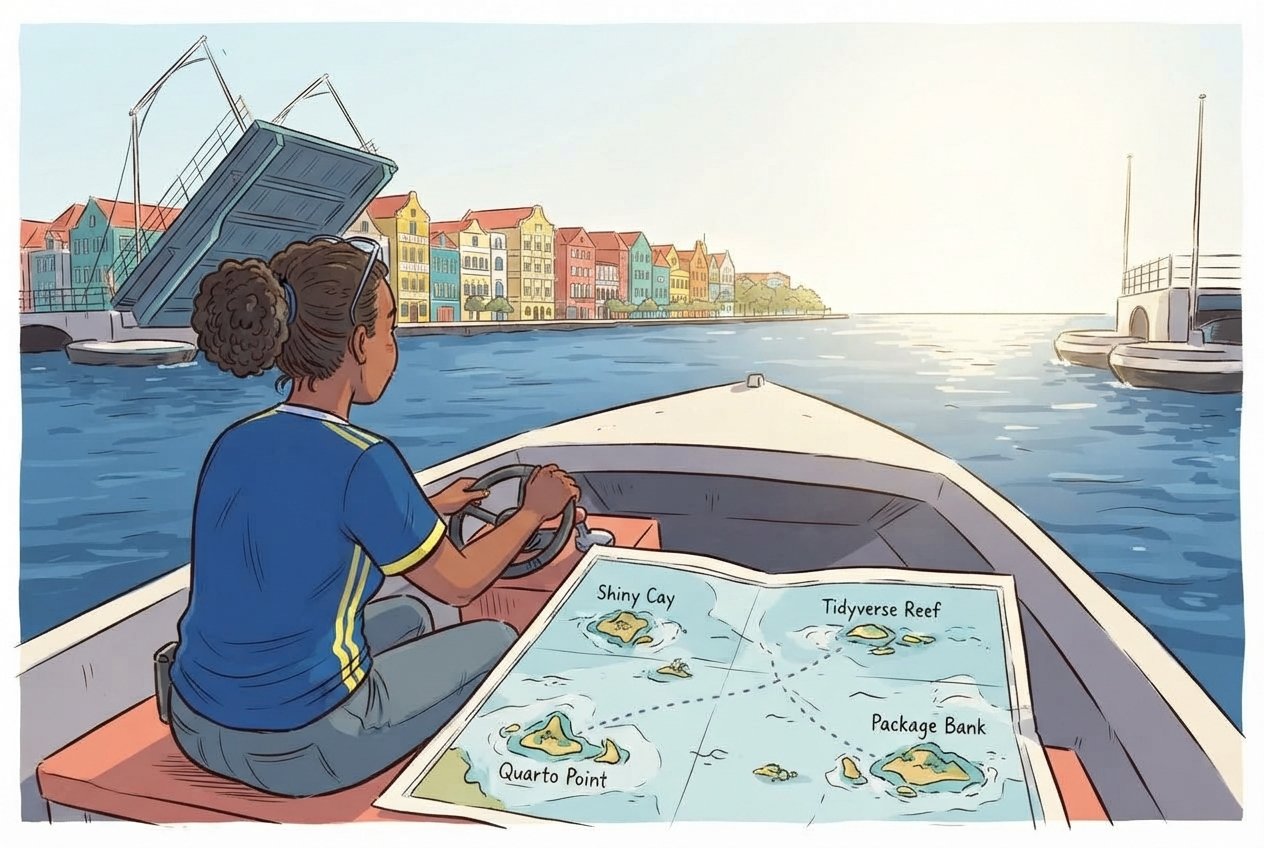
You have the basics. The map runs well past the
harbour mouth.
Image 1 of 1: ‘[decorative]’